Social Progress Index – India
The Social Progress Index (SPI) is designed to catalyse movement and drive action by presenting social outcome data in a useful and reliable way. Composed of multiple dimensions, it can be used to benchmark success and provide holistic, transparent, outcome-based measure of wellbeing that is independent of economic indicators.
About the project
My responsibility was to present raw data in a user-friendly manner to government and private stakeholders. I was responsible for creating a user interface and experience model that used different visual elements like maps, graphs, scorecards as well as interaction design. The application mapped 2581 data features based on 89 parameters for 28 states, allowing stakeholders to engage with the data interactively. The render of statistics in the application was carefully planned to not only offer features and functions but also add an element of gamification. Meticulous thought went into designing these aspects, allowing users to view relevant statistics and engage with the learning experience in an interactive and enjoyable way.

Design Screens
Features Planning
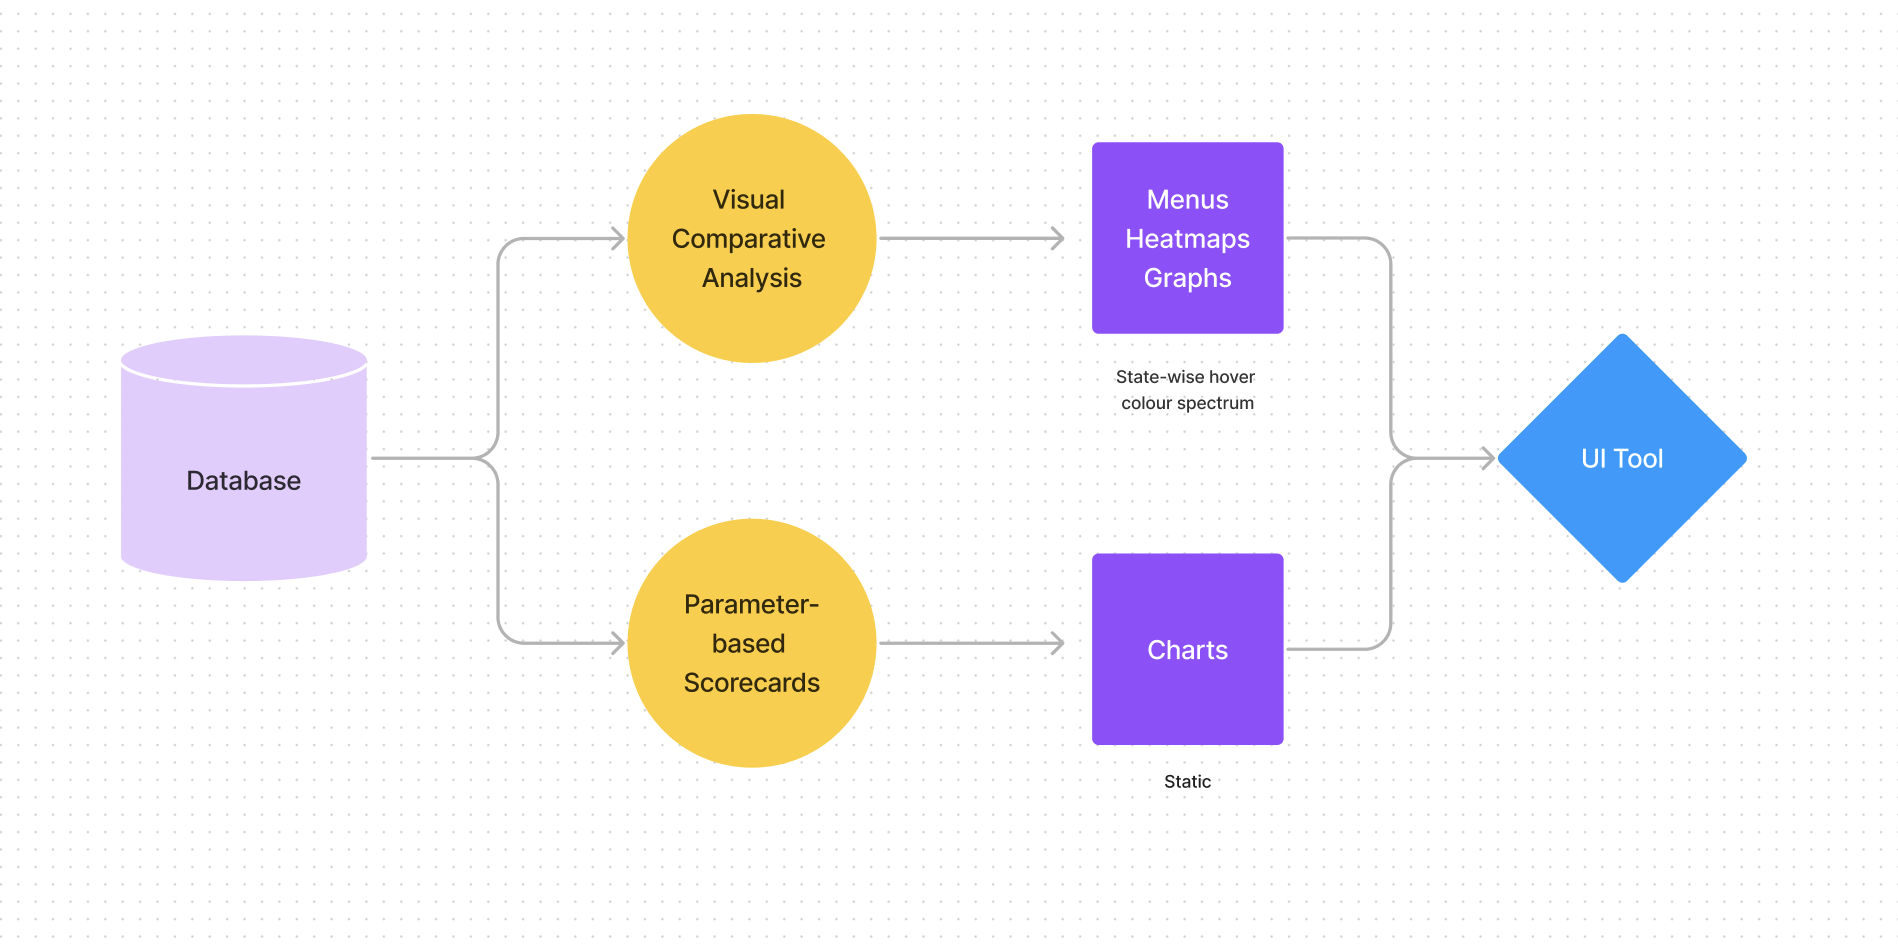
To ensure user-friendliness while presenting complex data, I made two primary design choices:
Utilizing quantitative and visual comparative analysis: I employed heatmaps and graphs to visually represent and compare data across different States. This approach allows users to easily grasp and interpret the information by observing patterns, trends, and variations.
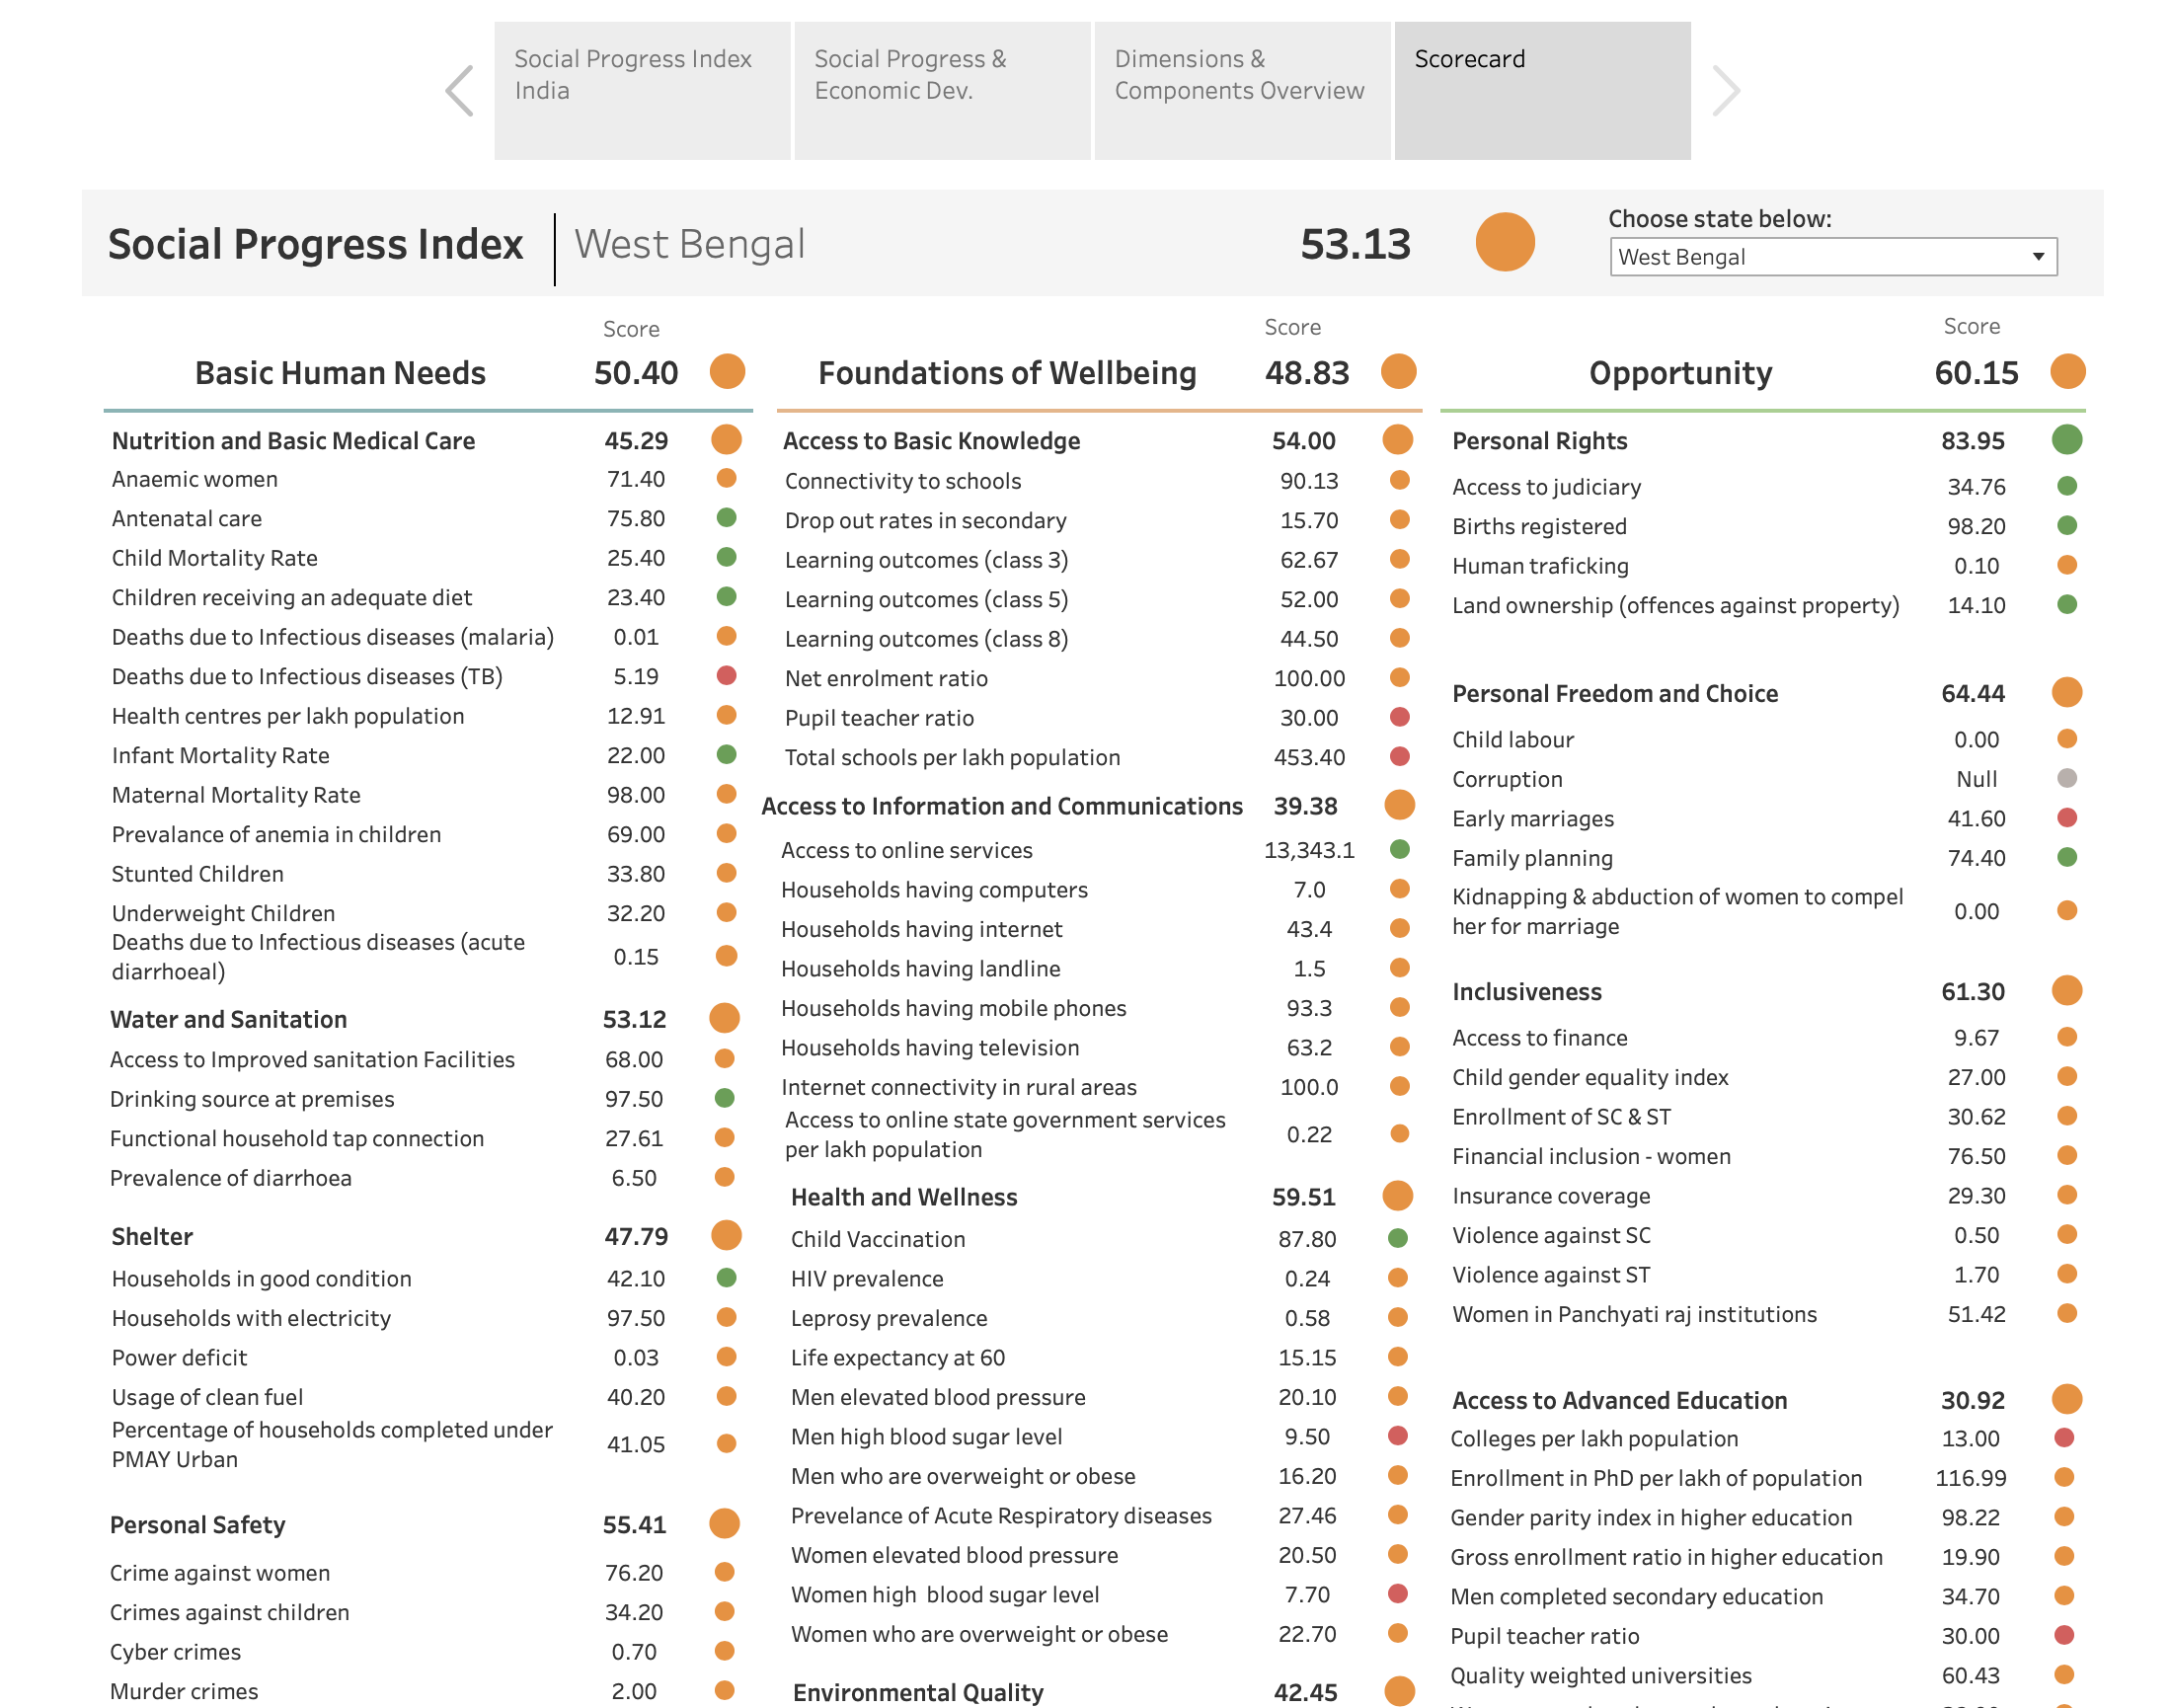
Implementing a scorecard for parameter-based State performance: I designed a scorecard that indicates the performance of each State for specific parameters. This provides a concise overview, enabling users to quickly assess and compare the performance of States based on the desired criteria.